


6.2 The S\(_N\)2 Reaction by Nudged Elastic Band#
Notebook overview#
The textbook Sₙ2 reaction: a chloride ion attacks chloromethane from behind, the three hydrogens flip through like an umbrella in the wind, and a chloride leaves from the front, \(\mathrm{Cl^- + CH_3Cl \to ClCH_3 + Cl^-}\). Knowing the reactant and product is not enough; we want the path between them and the barrier at its crest. The nudged elastic band (NEB) finds both: it strings a chain of replicas of the system between the two endpoints, connects them with springs, and relaxes the chain onto the minimum-energy path.
We take the course’s NEB calculation in CP2K and its committed output: the optimised reactant and product geometries, and the energy of every image at every iteration of the band optimisation. We render the two endpoints, whose bonded and departing chlorines exchange roles, read the converged band to plot the energy profile and extract the activation barrier, and watch the band converge onto the minimum-energy path over the optimisation.
Provenance. This notebook develops Lecture 13 of the course (nudged elastic band and free-energy calculations), an exercise designed by the author (Raymond Amador). The endpoint structures (
sn2-reactant.xyz,sn2-product.xyz) and the band energies (sn2-neb.ener) are the course’s own committed CP2K results. The full course credit is in the footer.
Reading a validation. Each task closes with a check against an independent fact: a symmetric reaction must give a symmetric path, the transition state sits at the top, the band must converge. A ✗ flags a mismatch; a ✓ is strong evidence, not proof.
Scope. Energies are the committed CP2K totals (Hartree, converted to kcal/mol); we analyse the band rather than rerun it. For the method see the nudged elastic band [HUJonsson00b].
Theory in brief#
The minimum-energy path#
A reaction follows the minimum-energy path on the potential surface: the lowest ridge crossing from the reactant valley to the product valley. Its highest point is the transition state, and the energy there above the reactant is the activation barrier Eq. 58,
Nudged elastic band#
The NEB discretises the path into a chain of images, copies of the system interpolated between the fixed endpoints. Adjacent images are joined by springs to keep them spread out, and each image is relaxed using only the force component perpendicular to the path (from the true potential) plus the spring force along the path. This “nudging” stops the images sliding into the endpoints or cutting the corner, so the converged chain traces the minimum-energy path, and its peak is the barrier. For the symmetric Sₙ2 exchange the path must be symmetric, with the transition state, the trigonal-bipyramidal \(\mathrm{[Cl\cdots CH_3\cdots Cl]^-}\), at its midpoint.
Setup#
The Setup below holds this notebook’s data and instruments — nothing you are asked to build. It is collapsed so the building stays yours; expand it whenever you want the details.
Exercise 1 — The reactant and product#
The two endpoints are mirror images: the same molecule with its two chlorines interchanged. In the reactant the carbon is bonded to one chlorine with the other chloride loosely approaching from behind; in the product the bonding has swapped. The hallmark of the Sₙ2 mechanism is that the three hydrogens invert as the reaction passes through a planar \(\mathrm{CH_3}\) transition state, like an umbrella turning inside out — so the product’s pyramid opens the opposite way from the reactant’s, and the product geometry is the reactant reflected through that planar midpoint.
Part a) Render the reactant and product.
Part b) Confirm the C–Cl bonding swaps between the two (the chlorine that is bonded becomes the one that leaves).
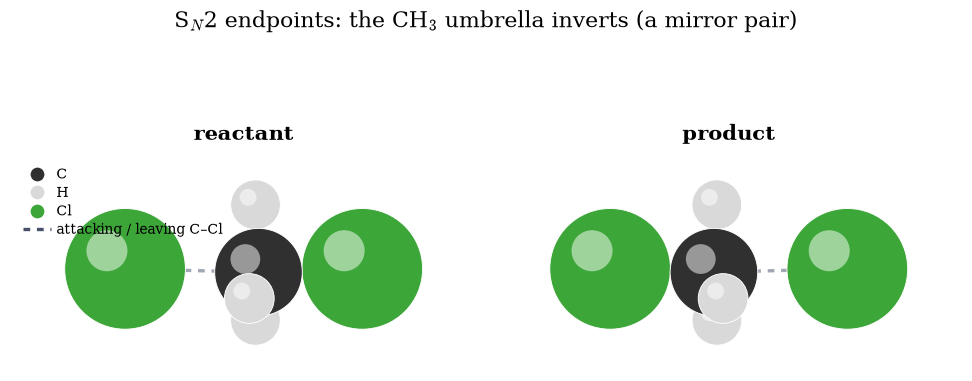
Fig. 66 The committed Sₙ2 endpoints: chloromethane with an attacking chloride (reactant) and the product after exchange (carbon grey, hydrogen white, chlorine green). The reaction swaps which chlorine is bonded to carbon; along the path between them, the three hydrogens invert through a planar transition state.#
reactant C–Cl distances: 1.76, 2.26 Å; product: 1.76, 2.26 Å
Validation 1 — a short and a long C–Cl bond at each end#
Each endpoint has one bonded chlorine (1.5–1.8 Å) and one departing/attacking chlorine farther out (~2.3 Å): the asymmetry that the reaction reverses.
✓ each endpoint has one bonded and one distant chlorine [reactant 1.76/2.26 Å, product 1.76/2.26 Å]
True
Exercise 2 — The minimum-energy path and the barrier#
The band optimisation writes the energy of every image at every step to a .ener
file; its last line is the converged path. We read the ten image energies, measure
each relative to the endpoints, and plot the profile against the reaction coordinate
(the cumulative distance along the band). The result is a single symmetric barrier;
its height is the activation energy of the exchange.
Part a) Read the converged band and plot the energy profile.
Part b) Extract the activation barrier and confirm the path is symmetric.
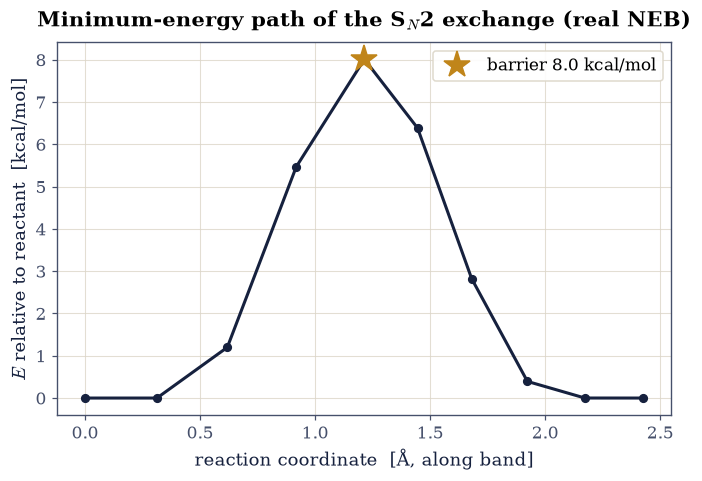
Fig. 67 Minimum-energy path of the chloride-exchange Sₙ2 reaction from the converged nudged-elastic-band calculation: image energy (kcal/mol, relative to the endpoints) against the reaction coordinate. The path is thermoneutral (equal endpoints) and approximately symmetric, and its single peak, the trigonal-bipyramidal transition state, sits ~8 kcal/mol above the reactant: the gas-phase central barrier of the exchange.#
activation barrier = 8.01 kcal/mol; transition state at image 4 of 9
Validation 2 — a central barrier on a thermoneutral path#
The chloride exchange is thermoneutral (reactant and product are the same molecule with its two identical chlorines swapped), so the endpoints must come out at equal energy, with a positive barrier of the right size (several kcal/mol) peaked near the middle of the band. The path is only approximately symmetric: the discrete images cluster unevenly around the transition state.
✓ the path is thermoneutral with a central barrier of the right size [barrier 8.0 kcal/mol at image 4; endpoint energy difference 0.000 kcal/mol]
True
Exercise 3 — Convergence of the band#
The band does not start on the minimum-energy path; it relaxes onto it. Each row of
the .ener file is one optimisation step, so plotting the barrier (the highest image,
relative to the endpoints) against step shows the band settling. It starts from the
straight-line interpolation between the endpoints, whose strained geometries
overestimate the barrier, and relaxes downward as the chain finds the true ridge,
converging after a few tens of iterations.
Part a) Compute the barrier at every optimisation step.
Part b) Confirm it has converged by the final steps.
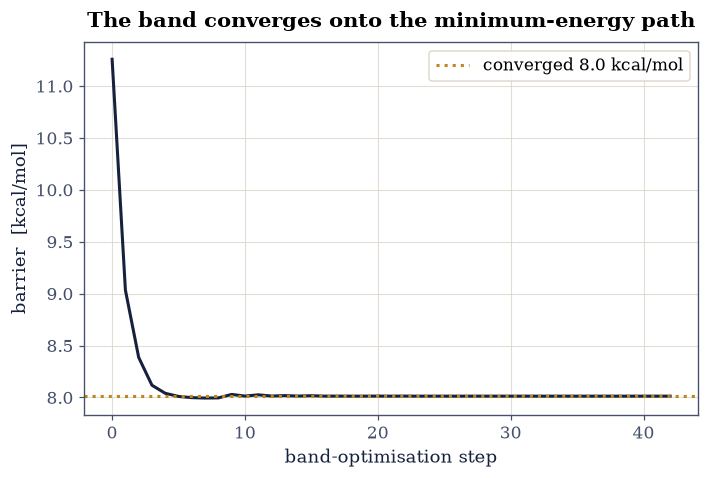
Fig. 68 Convergence of the nudged-elastic-band barrier: the activation energy (highest image relative to the endpoints) versus band-optimisation step. The initial straight-line interpolation overestimates the barrier through its strained geometries; as the chain relaxes onto the minimum-energy path the barrier falls and levels off, converged to ~8 kcal/mol after a few tens of iterations.#
Validation 3 — the band has converged#
By the final iterations the barrier must have stopped changing: the last few steps should agree to a small fraction of a kcal/mol.
✓ the NEB barrier has converged over the last few steps [change over the final 5 steps = 0.000 kcal/mol (converged at 8.01)]
True
Exercise 4 — Building the band: nudged elastic band from scratch#
We have read a nudged-elastic-band calculation without ever writing one. The method is the notebook’s title, and it is short enough to build in full — on a model surface, where the right answer is known in closed form and the band’s failure modes are visible rather than inferred.
The problem NEB solves is that a chain of images between two minima wants to do two wrong things. Left to slide downhill, every image falls into a minimum and the chain collapses to the endpoints. Tied together with springs and nothing else, the chain is pulled straight and cuts the corner, riding over ground far above the true path. The fix is to split the forces by direction. Along the local tangent \(\hat{\boldsymbol\tau}\) only the spring acts, keeping the images spread out; perpendicular to it only the potential acts, pulling the chain down into the valley:
Neither force is allowed to act in the other’s direction, and that single restriction is the whole method. The tangent itself needs care: the naive choice \(\mathbf R_{i+1}-\mathbf R_{i-1}\) develops kinks near the saddle, so we use the improved tangent of Henkelman and Jónsson [HUJonsson00b], which points toward whichever neighbour is higher in energy.
The test surface has a deliberately curved valley,
with minima at \((\pm1,0)\) and a valley floor along \(y=a(1-x^2)\), so the true saddle sits at \((0,a)\) with \(V=1\). A straight line between the minima passes through \((0,0)\), where \(V = 1+Ka^2\) — for \(K=5\), \(a=1/2\) that is \(2.25\), more than twice the real barrier. The band has to bend to find the truth, which is exactly what makes the relaxation worth watching.
Part a) Implement neb_relax(band, k_spring, n_steps, dt). For each interior
image: form the improved tangent, normalise it, project the potential gradient onto
the plane perpendicular to it with numpy.dot, add the spring term along it from
Eq. 59, and step every image by steepest descent. Hold the endpoints
fixed — they are minima already, and releasing them would let the whole band slide
into one basin.
Write this one yourself — the implementation is the lesson.
Part b) Relax a straight-line band of eleven images and animate it. Watch two things at once: the chain bending up into the curved valley, and the images redistributing themselves evenly as the springs equalise their spacing.
Part c) Check the converged band against the closed-form answer — the barrier height, the saddle position, and the evenness of the spacing — and compare its barrier with the straight-line estimate it started from. That ratio is the size of the error a linear-interpolation guess would have handed you.
straight-line band peak V = 2.2500 (at image 5)
relaxed band peak      V = 1.0000 (at image 5)
true saddle:             V = 1.0000 at (0, 0.5)
relaxed peak position    = (+0.00000, +0.50000)
image-spacing spread     = 0.0112 (springs equalise what the potential would not)
linear interpolation overestimates the barrier by 125 %
Fig. 69 Animation of a nudged-elastic-band relaxation on the model surface of Eq. eq-neb-surface, whose minimum-energy path is curved. Left: contours of \(V(x,y)\) with the eleven-image band; it starts as the straight line between the two minima (which cuts the corner and rides far too high) and bends upward onto the valley floor, the images spreading evenly as the spring term equalises their spacing. Right: the energy profile along the band at the same instant, falling from a straight-line peak of 2.25 to the true saddle value of 1.00. The endpoints are held fixed throughout; releasing them would let the whole chain slide into one basin.#
Validation 4 — the band lands on the analytic saddle#
The model surface was chosen so the answer is known exactly, which makes every check here a comparison against closed form rather than against another calculation. The relaxed barrier must equal \(V=1\) and its position \((0,a)\); the springs must have equalised the image spacing, since that is their only job; and the straight-line band it started from must be substantially too high, which is the reason the relaxation was needed at all. Nothing here is random, so the tolerances are tight.
✓  the relaxed band's barrier equals the analytic saddle value of the surface in eq-neb-surface   [got 1 vs expected 1 (rtol=0.001, atol=1e-09)]
✓  and it sits at the saddle POSITION (0, a): the band bent up into the curved valley rather than cutting the corner   [max|Δ| = 2.22045e-16 (rtol=1e-06, atol=0.002)]
✓  the spring term has spread the images evenly along the path, which is the only thing it is permitted to do   [spacing spread 0.0112 across 11 images]
✓  and the straight-line guess it started from overestimates the barrier by more than a factor of two: on a curved path, linear interpolation is an upper bound that can be very loose   [straight line 2.250 vs relaxed 1.000]
True
Exercise 5 — The climbing image#
Exercise 4’s from-scratch band has a quiet dependence it should not have: its barrier estimate is the energy of whichever image happens to sit highest, and where the images sit depends on how many there are. Give the band an odd count on a symmetric path and a node lands on the saddle by luck; give it an even count and every image misses the top — the measured barrier undershoots by the discretisation, however well the band has converged.
The climbing image [HUJonsson00a] removes the luck. After the band has roughly converged, its highest image changes contract: the spring force on it is switched off, and the true force’s component along the path is inverted,
so that one image minimises across the path and maximises along it — it climbs to the exact saddle wherever the band’s nodes fall. One image obeys Eq. 61; its neighbours keep the ordinary NEB contract and follow it up.
Part a) Extend the Exercise 3 machinery with the climbing contract and run both versions on the model surface with an even band, where no node can sit at the top. Write this one yourself — the implementation is the lesson.
Part b) Measure the cure: the plain band’s highest image against the exact saddle energy, the climber against the same — and then re-read the committed CP2K band with the sharpened eye, bounding how well its barrier is resolved from its own image spacing around the maximum.
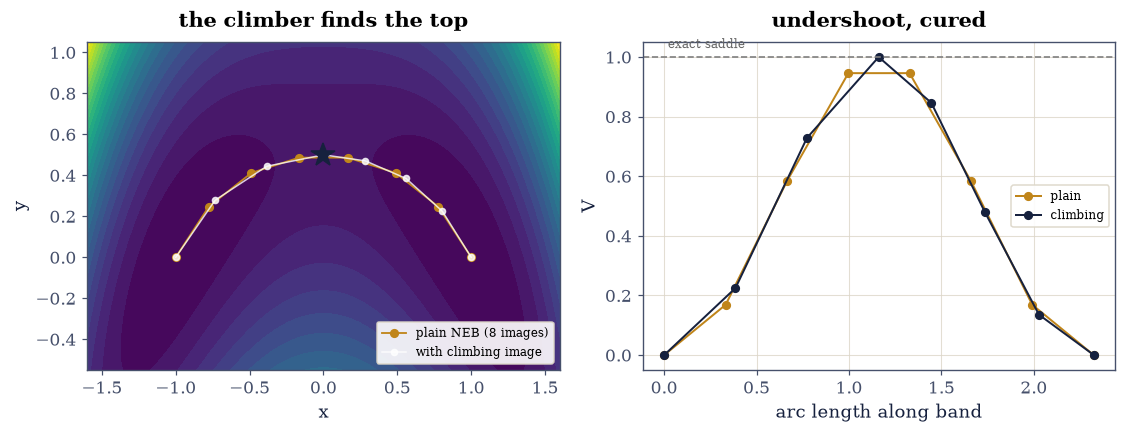
Fig. 70 The climbing image on the model surface with the curved minimum-energy path, using an eight-image band so that no node can sit at the saddle by luck. Left: both converged bands on the energy landscape; the plain band’s images (amber) straddle the saddle and its best image undershoots the barrier, while the climbing image (navy star) has walked to the exact saddle point regardless of where its neighbours sit. Right: the energy profiles along both bands; the plain band’s maximum is bounded by its discretisation, the climber’s is the saddle energy itself. The same argument bounds the committed CP2K band’s barrier resolution by its own image spacing around the maximum.#
plain NEB best image undershoots the saddle by 0.0541; climbing image error 0.00e+00 at (-0.0000, 0.5000)
committed CP2K band: top image 8.01 kcal/mol, drop to nearest neighbour 1.63 kcal/mol -- the barrier is resolved no better than that
Validation 5 — luck removed, resolution bounded#
Four checks. The plain even-image band must undershoot the exact saddle — the discretisation error the climbing image exists to remove, demonstrated rather than asserted. The climber must land on the exact saddle in energy and in position. Its error must be far below the plain band’s. And the committed band’s own resolution bound must be a small fraction of its barrier, which is what makes Exercise 2’s quoted number trustworthy.
✓  with an even band no image can sit at the saddle, and the plain NEB's best image undershoots the exact barrier by its discretisation   [undershoot 0.0541 (exact saddle V = 1)]
✓  the climbing image lands on the exact saddle energy regardless of where the band's nodes fall   [got 1 vs expected 1 (rtol=1e-06, atol=0.001)]
✓  and on the exact saddle POSITION (0, a) of the curved path, not merely on an energy contour of the right height   [climber at (-0.0000, 0.5000), saddle at (0, 0.5)]
✓  the cure is an order of magnitude, and the committed CP2K band's own image spacing bounds its barrier resolution to a small fraction of the quoted value   [errors 0.0e+00 vs 0.0541; CP2K resolution 1.63 of 8.01 kcal/mol]
True
Notebook summary#
We traced the minimum-energy path of the symmetric S\(_N\)2 chloride exchange with the nudged elastic band, reading the course’s committed band energies. The converged path is a single barrier on a thermoneutral profile, with the trigonal-bipyramidal transition state about \(8\,\)kcal/mol above the reactant, and following the barrier over the band optimisation showed it relaxing downward from the strained straight-line interpolation onto the true ridge. The endpoints fix the chemistry; the band finds the route between them.
Outlook#
The climbing image. A climbing-image NEB drives the highest replica exactly to the saddle point, giving the barrier without interpolating between images.
Free energy, not energy. The course continued to a free-energy surface from metadynamics (next notebook); the energetic barrier here is its zero-temperature limit.
Solvent. The gas-phase Sₙ2 has a double-well shape with a small central barrier; in water the ion-dipole wells largely vanish and the barrier rises sharply, the classic solvent effect on Sₙ2 kinetics.
Endpoint quality. A NEB is only as good as its endpoints; both must be true minima, which is why the exercise optimised them first.
References#
Graeme Henkelman, Blas P. Uberuaga, and Hannes Jónsson. A climbing image nudged elastic band method for finding saddle points and minimum energy paths. The Journal of Chemical Physics, 113(22):9901–9904, 2000. doi:10.1063/1.1329672.
Graeme Henkelman, Blas P. Uberuaga, and Hannes Jónsson. A climbing image nudged elastic band method for finding saddle points and minimum energy paths. The Journal of Chemical Physics, 113(22):9901–9904, 2000. doi:10.1063/1.1329672.